
There are all kinds of personal finance statistics floating around on the internet. It’s easy to quote a financial statistic to support almost anything you have to say.
In the past few years of researching personal finance, I’ve read A LOT of statistics. Some come from reliable sources, and some not so much. And many times, the source isn’t even quoted – it’s just assumed because the author read it on another blog somewhere. My goal is to create a repository of credible statistics that tell the story of the American financial landscape.
PERSONAL FINANCE STATISTICS
I wanted to create a resource that documented some of the absolute best and most useful financial statistics for three reasons:
- To provide a resource with the most up-to-date statistics available from the most reliable sources
- To gain perspective on where Americans as a whole line up financially and where we can improve
- To give you, the reader, a quick reference to compare to your own financial situation
But first, a huge caveat on #3…
Keeping Up with the Joneses is a Losing Battle
While comparing your personal finances to the average (or median) American can be useful to know where you stack up, aiming for average is never where you want to be. There are some truly shocking financial statistics below that show the sad state of the average American.
Everyone’s situation is different, but with a few simple tweaks it should be relatively easy to be more financially secure than the average person. That’s what this blog is all about – giving you tips to make extra money, save more money, and build wealth without sacrificing your quality of life.
At the same time, don’t get discouraged if you don’t measure up. Everyone’s at a different life stage. Someone graduating college will on average have a lower income than someone in their prime earning years. And the younger you are, the more likely you are to have a large student debt balance.
Don’t use these statistics as a way to beat yourself up where you fall short, but as a checklist of things you can improve to become more financially literate and prepared for the future.
IMPACT OF COVID-19 ON PERSONAL FINANCES
I would be remiss if I didn’t start out with one of the major drivers of change in personal finance statistics – the Coronavirus pandemic.
A lot of the surveys being published in 2020 and 2021 use data from 2018-2019 so the full effect of the pandemic is not reflected in many of the statistics below.
A recent survey from the Pew Research Center documents some of the impacts of the pandemic on personal finances:
- Half of adults who lost a job due to Coronavirus are still unemployed
- 25% of adults have had trouble paying their bills
- 33% used money from savings/retirement to pay bills
- The numbers vary widely by race and income level
- 46% of lower income people had trouble paying bills vs. 19% of middle income and 5% of upper income
- 43% of blacks, and 37% of hispanics had trouble paying bills vs. 18% of whites
- 25% of people say they or someone in their household was laid off due to Coronavirus
- Those in lower-income brackets and younger workers were hit harder
- 32% of those age 18-29 lost their job vs. the average of 25%
- 33% of those in a lower income bracket lost their job vs high income of 14%
- 60% of those that were laid off are still earning less than before
- Those in lower-income brackets and younger workers were hit harder
INCOME STATISTICS
- The median household income in the U.S. is $63,179 according to the U.S. Census Bureau’s 2018 Current Population Report (published June 2020):
- This is the first year that real (inflation-adjusted) median income has passed it’s pre-recession peak in 2007
- The median household income of $63,179 in 2018 is a 0.9% increase from the previous year
- Median household income by state ranges from $43,469 (West Virginia) to $82,372 (District of Columbia)
- Median household income in the 25 most populous metropolitan areas ranges from $52,212 (Tampa, FL) to $101,714 (San Francisco, CA)
- Median earnings by age bracket are compiled quarterly by the Bureau of Labor Statistics (published Q3 2020):
- 16 – 24 years old: $31,512 (reported weekly and converted to annual)
- 25 – 34 years old: $47,736
- 35 – 44 years old: $58,708
- 45 – 54 years old: $60,008
- 55 – 64 years old: $57,616
- 65+ years old: $52,312
- On average, women earned 18.3% less than men
*Note: Household income reported by the Census Bureau includes all income in a household unit (which may include multiple workers). Earnings reported by the Bureau of Labor Statistics is for an individual worker.
 [Source: U.S. Census Bureau]
BUDGETING & SPENDING STATISTICS
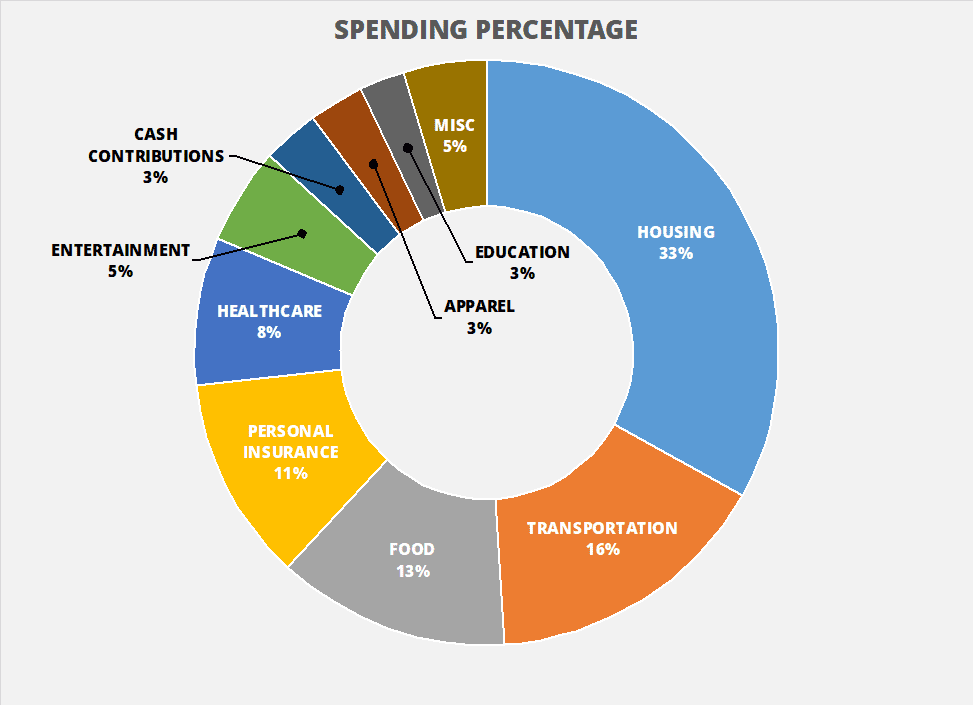
- Annual consumer spending averaged $63,036 on pre-tax average income of $82,852 according to the latest BLS 2019 Consumer Expenditures Report (published December 2020):
- This is a 3% increase over previous year spending, with the biggest changes coming from Transportation (+10%) and Healthcare (+5%)
- Housing (33% of spending) and transportation (16% of spending) account for almost half of total spending
- Health insurance costs make up almost 70% of healthcare spending
- 43% of spending on food was from restaurants or take-out
- Total spending left only 18% of income available to pay taxes and contribute to savings
- According to FINRA’s 2015 NFCS survey, only 40% of respondents spent less than they earn. 38% lived paycheck to paycheck, and 18% consistently spent more than they earned.
- In the same survey, only 39% said they were confident they could come up with $2,000 in an emergency.
- Only 41% of people follow a budget, according to a 2016 study by U.S. Bank.
RELATED: Dave Ramsey’s Recommended Budget Percentages – How Do You Stack Up?
DEBT STATISTICS
- According to the Federal Reserve’s Consumer Credit G.19 Report (November 2020):
- Total consumer debt is $4.163 trillion ($12,684 per capita)
- Revolving (credit card) debt is $956.5 billion ($2,914 per capita)
- Total student loan debt is $1.7 trillion
- Total auto loan debt is $1.2 trillion
- Total household debt is $14.35 trillion as of Q3 2020 according to a report from the Federal Reserve Bank of New York:
- This is 13.2% above the previous peak in Q3 2008
- Mortgage debt totaled $10.22 trillion
- Average student loan debt is $32,741 and median debt is $17,000 (Federal Reserve Report on Economic Well-Being 2017):
- Considering other forms of debt taken out for education (credit cards, home equity loans, etc.) median education debt rises to $19,000
- 19% of those with outstanding student loans are behind on payments
- The average household has $135,065 of debt according to a 2018 survey by Nerdwallet:
- Average household credit card debt: $6,741
- Average household mortgage debt: $185,591
- Average household auto debt: $27,630
- Average household student loan debt: $47,634
SAVINGS AND RETIREMENT STATISTICS
- According to a 2018 survey by GOBankingRates, Americans still struggle to save money:
- 58% of survey respondents had less than $1,000 in a savings account
- Women have a harder time saving than men – 62% of women had less than had less than $1,000 vs. 53% of men
- Millennials are doing a better job saving than older generations – only 26% had nothing in savings
- 31% said their biggest obstacle to savings was living paycheck to paycheck
- Based on analysis from the Center for Retirement Research in 2017, median retirement savings in a 401(k)/IRA are well below the recommended retirements savings by age:
- Only half of households have any retirement savings in a 401(k) or IRA
- Median household retirement savings by age:
- 35-44 years old: $40,000
- 45-54 years old: $97,000
- 55-64 years old: $135,000
- The average American household has $180,040 in savings and retirement accounts according to analysis by Magnify Money:
- Median savings and retirement account balances look much worse – only $12,120
- The top 1% of households have average savings of $2,517,270
- The bottom 20% of households have an average savings of $8,790
- 21% of Americans have NO retirement savings according to Northwestern Mutual’s Planning & Progress Study 2018:
- 55% of Americans believe they will have to work past age 65
- 43% think there is a possibility they will outlive their retirement savings
NET WORTH STATISTICS
- From the Federal Reserve Survey of Consumer Finances in 2020:
- Median family net worth is $121,700
- Median net worth by educational attainment:
- High school diploma: $74,000
- College degree: $308,200
- Median net worth for homeowners vs. renters:
- Homeowner: $255,000
- Renter: $6,300
- Median net worth by age:
- <35 years old: $13,900
- 35-44 years old: $91,300
- 45-54 years old: $168,600
- 55-64 years old: $212,500
- 65-74 years old: $266,400
- 75+ years old: $254,800
FINANCIAL LITERACY STATISTICS
- According to the 2018 NFCC Financial Literacy Survey:
- 1 in 4 Americans admit they do not pay their bills on time
- 29% of Americans are saving more now than a year ago (particularly Millennials)
- 61% have had credit card debt in the last year, and 38% carry debt month-to-month
- 55% of Americans give themselves a grade of A or B on their personal finance knowledge
- Despite being the world’s largest economy, Americans rank 14th in financial literacy (slightly higher than Botswana) according to Standard & Poor’s Global Financial Literacy Survey
FINANCIAL STATISTICS TAKEAWAY
I am a numbers nerd, so I love statistics. I hope you were able to take away a few interesting facts about the state of personal finance today.
But numbers by themselves can’t inspire change or help you grow their wealth. That takes a commitment to changing behavior and creating a better future for your family.
Here are some of my key takeaways from all of my research into these financial statistics:
- The majority of people live paycheck to paycheck regardless of income. In order to really get ahead you have to commit to spending less than you earn and avoid trying to keep up with the Joneses. This is true at every income level. Expenses as a percentage of income don’t vary a whole lot no matter if you make $30k or $1M per year.
- There is still a lot of financial inequality in America. Women consistently have a harder time earning and saving as much as their male counterparts, and the top income earners control a majority of the wealth.
- The levels of consumer debt indicate a general disdain for delayed gratification. Consumer debt is almost all discretionary – trading future income for goods and services now. Without a mindset shift to live within your means and delay purchases until you can afford them, consumer debt will continue to grow.
- Education is still a major contributor to “getting ahead”. While the cost of a college education continues to rise, it is still correlated with higher income, more savings, and a greater net worth overall.
Which financial stats stuck out to you? See anything missing or that needs to be updated? Let me know in the comments!
[ad_2]
Source link
